
Intro:
Over the last few months, I have been spending a ton of time in Login Enterprise in my home lab doing testing of various things to come in the blog. Stay tuned for more to come with this as I have free time will write more on this as I progress deeper and deeper into the product.
In the middle of January there was a version of Login Enterprise released that has included some amazing features. In the 5.7.2 version they added the ability to use Custom Session Metrics from the GUI. This was available before but had to do it via API this came in 5.4.6. With all that said let’s dive into this thing.
News, I have created a Youtube video on this also if it makes it esier.
Why Custom Session Metrics?

As your environment evolves and go need to get more and more metrics you will need to customize Login Enterprise for your needs. To give you more detailed and more personalized data and reports based on your environment. In Continuous Testing loads, this no allows you real-time data customized to your environment. This will help structure your testing to be to fine tune your environment to get the most out of it with the best customer experience.
Gathering Information for Custom Session Metrics:
We need to open a VDI session so we can gather the data needed. For me, I will be using my VMware Horizon Lab to do this.
Gathering Perfmon Information for Custom Session Metrics:
Click on Start button and Type PerfMon, and launch Performance Monitor, click on Performance Monitor once you do that it should look something like below:

Right click where the monitor data is at the bottom and choose remove all metrics. Then lets right click again and choose “Add Counters”. In the list, we are going to scroll up till we find “LogicalDisk”, and click on it, on the right of the “LogicalDisk” line there is a down carrot click on it to show all metrics and click on “% Idle Time” and click the add button, then click OK.

This will display the data needed to build out the Login Enterprise Custom Monitor.

Take Note of the following Data:
- Object
- Counter
- Counter Instance
Gathering WMI Information for Custom Session Metrics:
Click on start menu and type in Powershell and click on it.
Once it launches we need to run the following command to list the Avalable WMI metrics.
Get-WmiObject Win32_PerfFormattedData | Select-Object -Unique __Class | Format-Table -AutoSizeIt will take a few seconds to run, but once it completes it should look something like below.

For our example we are going to use the “VMware Blast Session Counters”Win32_PerfFormattedData_Counters_VMwareBlastSessionCounters”, so lets scroll up and copy the name so we can use it in the next command, now run the following command to get detailed WMI data, you can edit for your metrics you want to grab.
Get-WmiObject -Query "SELECT * FROM Win32_PerfFormattedData_Counters_VMwareBlastSessionCounters"It should display something like below:
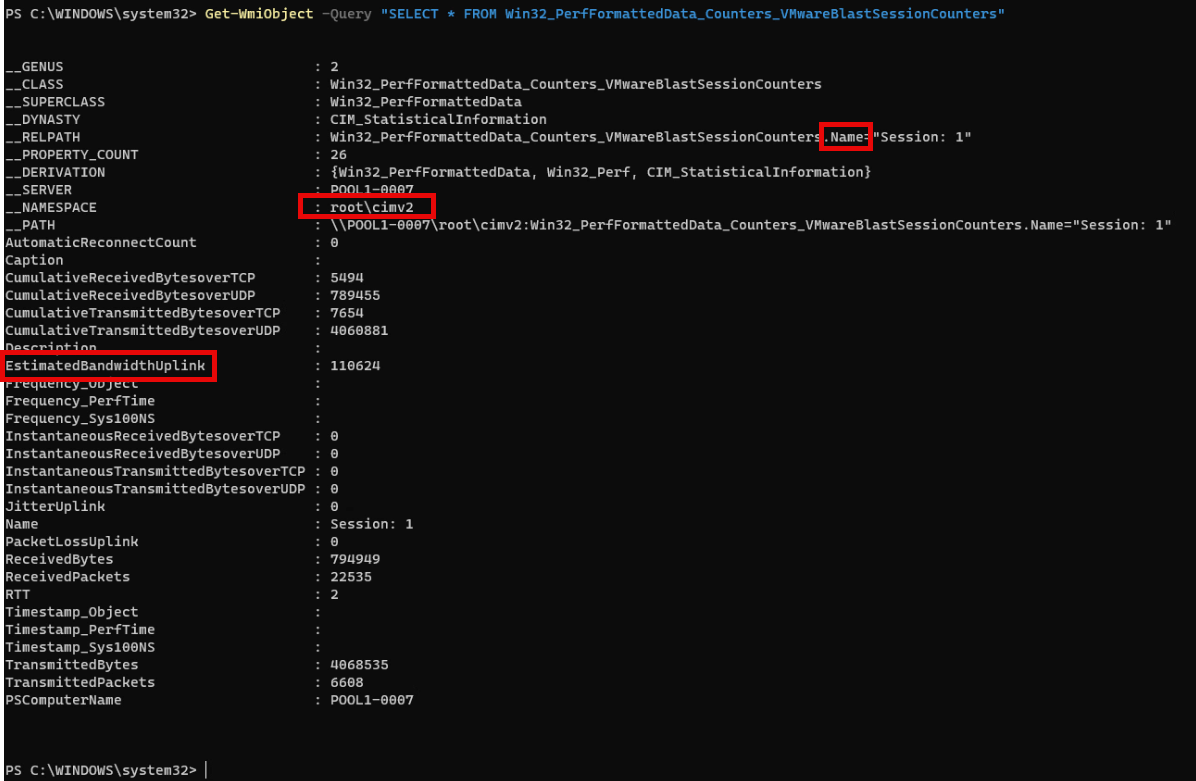
As you see above, we need to note the sections with red boxes, for entry in Login Enterprise. And now that we see the metric we want to gather is “EstimatedBandwidthUplink” we can write our SELECT query, and test it out real quick.
Get-WmiObject -Query "SELECT EstimatedBandwidthUplink FROM Win32_PerfFormattedData_Counters_VMwareBlastSessionCounters"Above is our Query, you can add more than one Metric by doing comma seperated. For our example we are just doing one metric, it should output something similar below:

Creating Custom Session Metrics:
First log into Login Enterprise, go down to “Session Metrics”, by default there are two in there called CPU and Memory Utilization.
From here we are going to click the “Add New Session Metrics” button in the upper right of the page.

Creating “PerMon” Custom Session Metric
We are going to fill out the fields from VDI session like below:

Once complete we are going to click Save button.
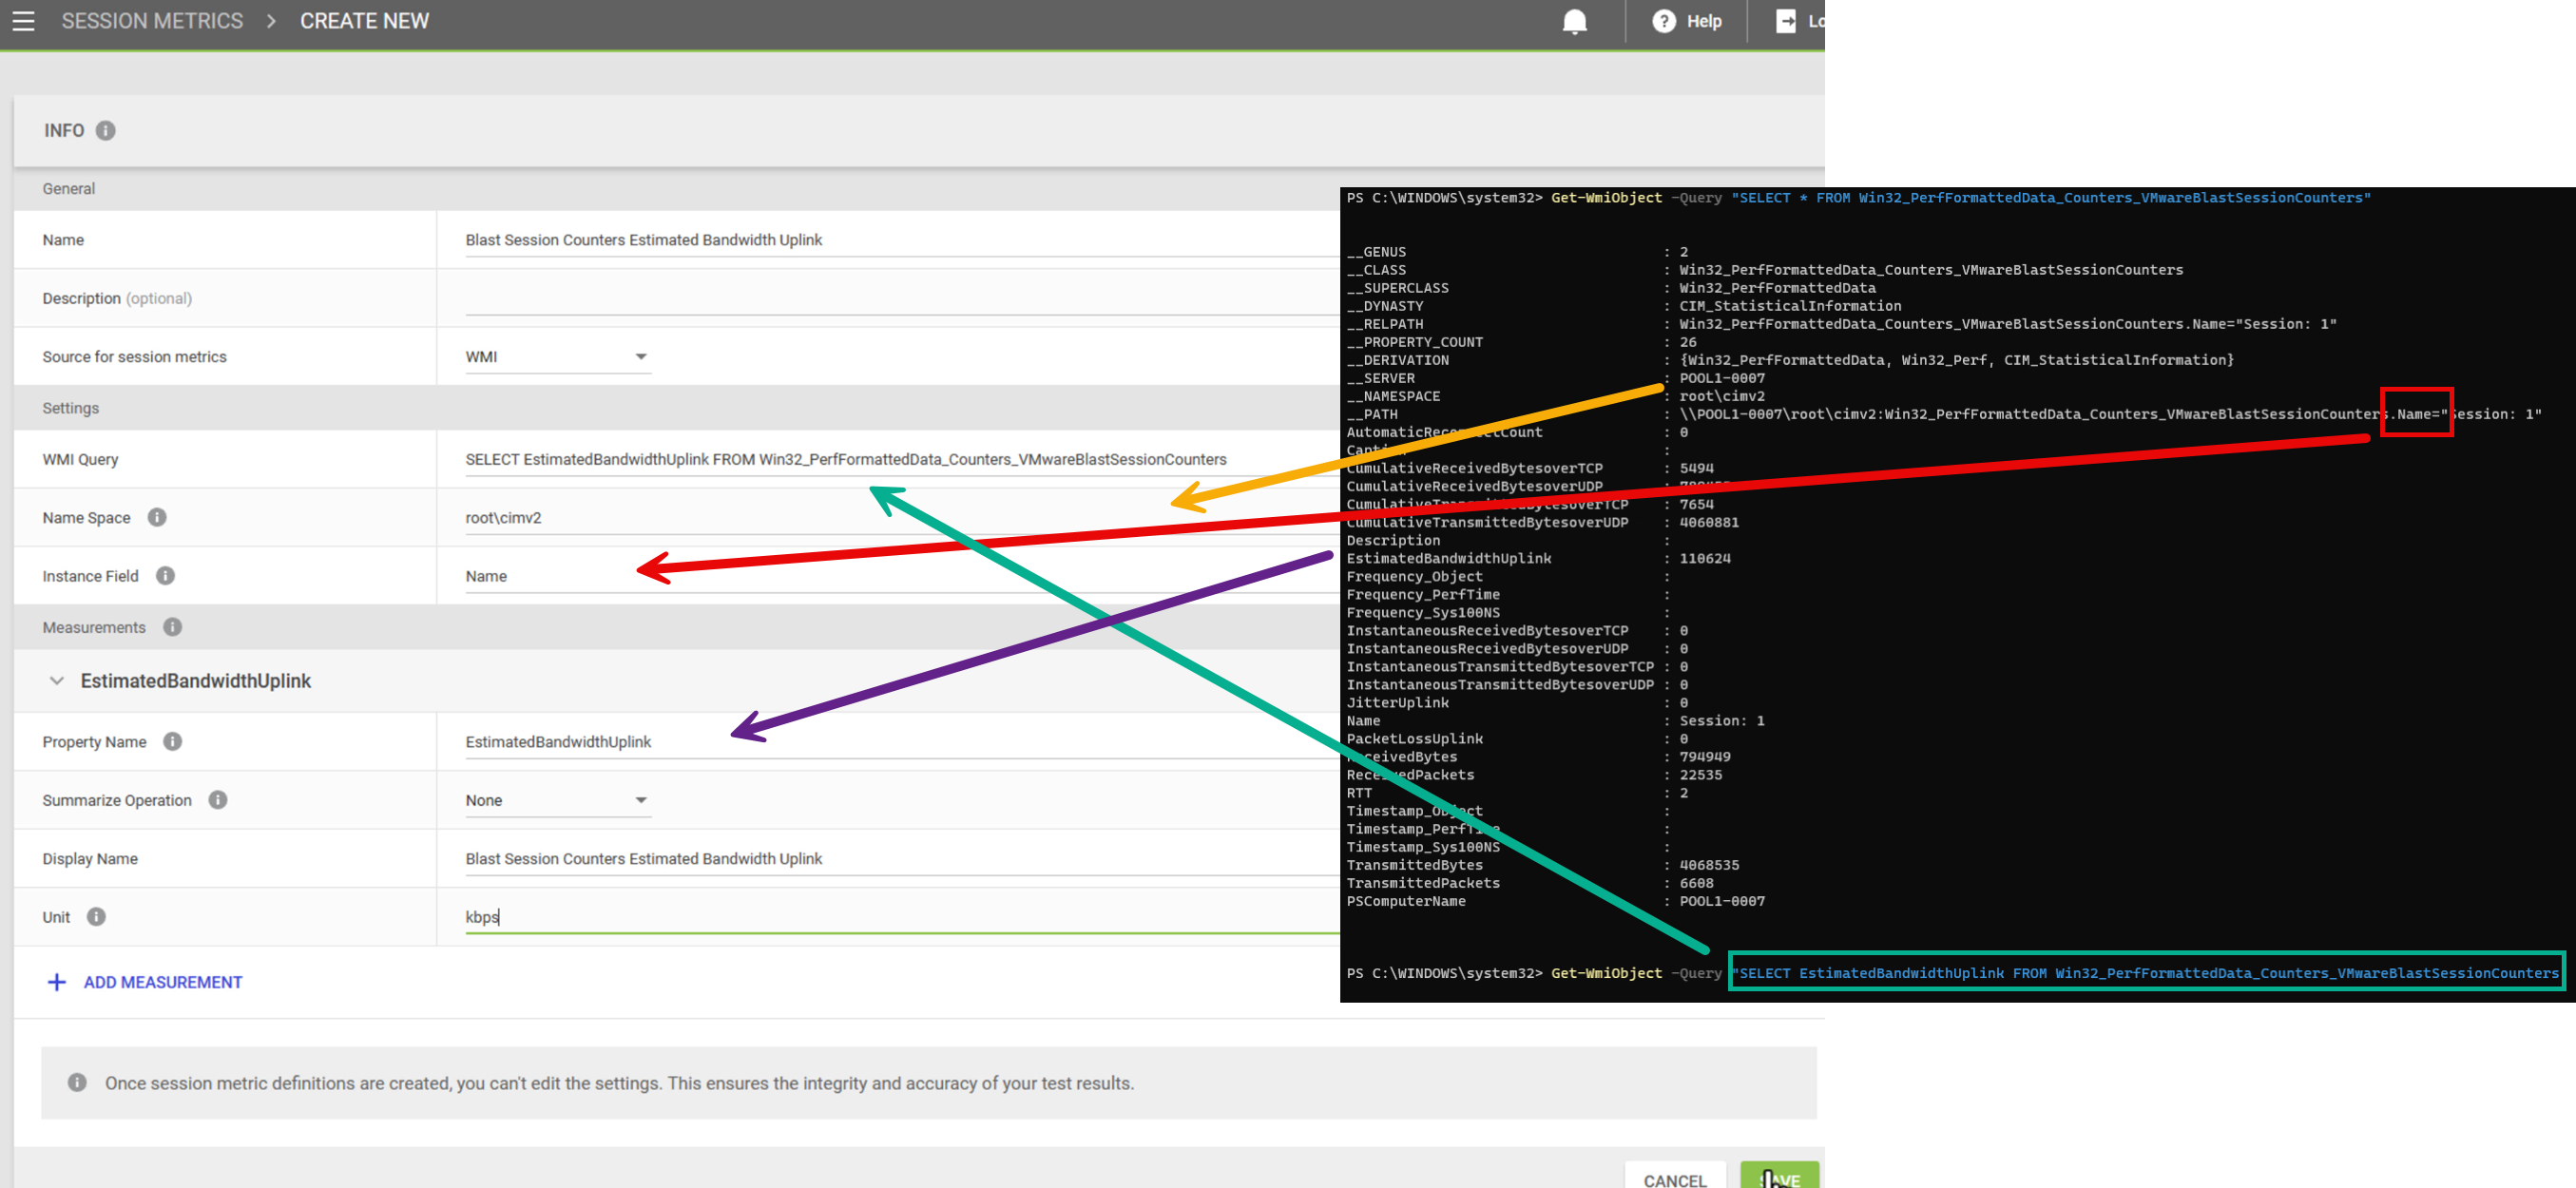
Creating “WMI” Custom Session Metric
We are going to fill out the fields from VDI session like below:
Note: Be careful to not follow the instructions on “Name Space” as it will want you to put in root\\cimv2 and that will not work. I had to play email a friend to get clarification as I could not get WMI to work. But if you enter it correctly as “root\cimv2” it works! So don’t follow the onscreen directions on this one.
Once complete we are going to click Save button.
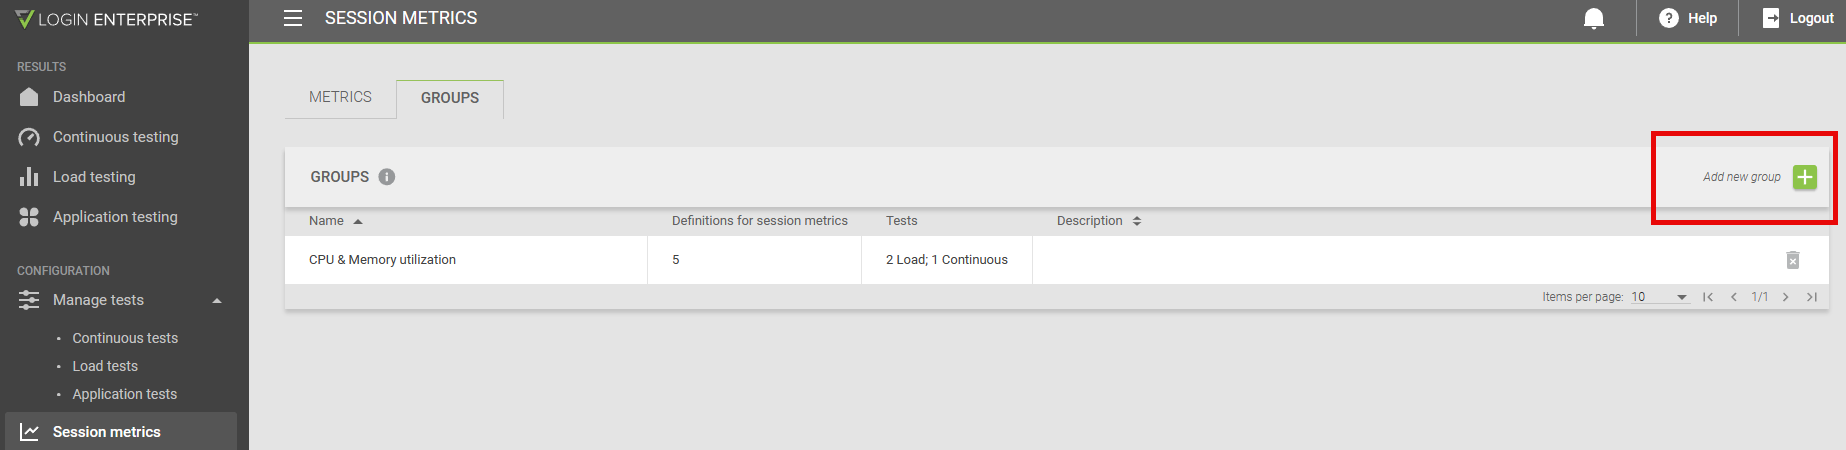
Creating New Session Metric Group:
In the Session Metrics section click on Groups tab. You will have the default group there called “CPU & Memory utilization” we are going to create a new one for our Custom Metrics. Please note that you can only assign one group per test, so if you want metrics from other groups add them to metric. No thats said click on the “Add new group” button in the upper right hand side of the page.
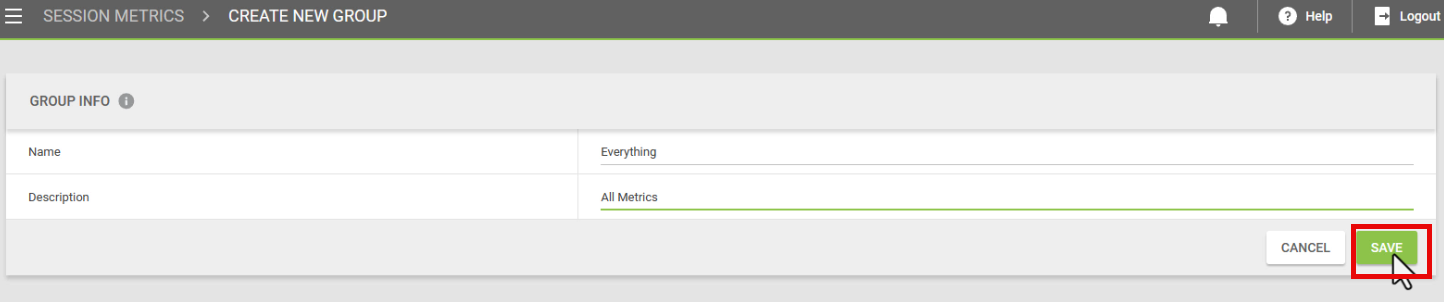
On the new window we are going to name the group, and for me it will be “Everything” and you can add a description if you like. Once you are complete with that click Save.
After you click save, it will will expand options. Lets go down and click “Add Session Metric Definitions” button.

For me, I am going to select All.

And click save. We can not add to tests unless you have tests that do not have any groups assigned to them, For me I am going to have to go edit my Continuous Test and assign the “Everything” group to it.
Assign the new Custom Session Metrics Group:
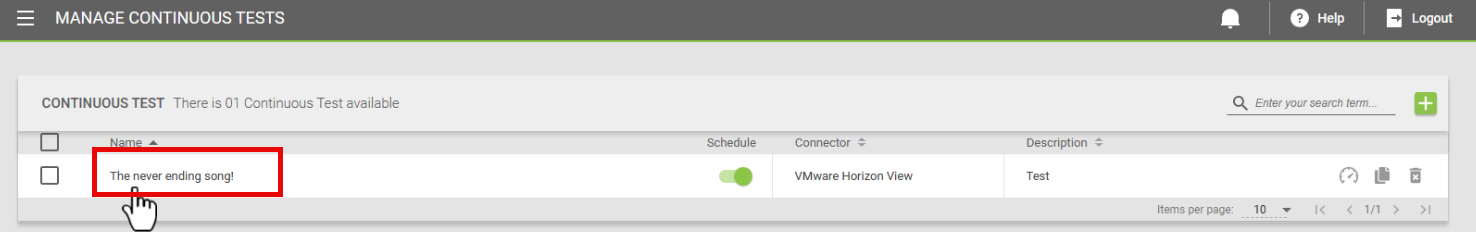
For this usecase we are going to go to “Manage Tests” we are going to click on “Continuous Tests”, and then click on the test name so we can edit it. For me my Continuous Test is called “The never ending song!”
Scroll down till you find “Metrics Group” and click on the drop down and select your new group you just created, For me its called “Everything”

Now you can navigate back to your Session Metric group, and you can validate your group has been added to it. As you can see below, it shows one continuous test added to the Everything group.

Looking at Testing Metrics:
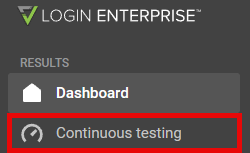
Now lets go see our handy work, at the top section under Dashboard is “Continuous Testing” click on it.
If you select “Session Metrics” at the bottom and uncheck CPU and Memory, and check “Blast Session Counters” you should see the session metrics for that WMI counter:

Now lets uncheck “Blast Session Counters” and select “Disk Idle Time” and you should see data.

Conclusion:
There is a lot of customiztion capabilities in this product. For me this was a challange to work through this a bit. A few things to keep in your mind. Is you can only assign on Metrics group per test. But you can assign Custom Metrics to many groups.
Also, when looking at reporting, you can only view data of the same data type, so if Memory and CPU are based off “#” and you want to look at Blast Session Counters it won’t let you as its in “kbps”. So just little things to call out.
Link here is for the LoginVSI Enterprise setting up Custom Session Metrics. It’s a bit lacking so I created this.
Session Metrics – Login VSI
There are other ways to add these via API calls as needed and that is really documented well in the above article.

